undefined

Recently, I wrote a recipe for David Jane’s homestar.io Internet of Things platform to mimic f.lux. I’ve used f.flux on my Macbook the past few years and I like its calming light later at night, so I was keen to match my computer screen with my room lighting using a Philips Hue controlled by Home*Star.

F.lux works by shifting the color of the entire computer screen to that of a screen reflecting light at sunset. Studies have shown that the “blue” light produced by computer screens and LED lighting mimics daylight: it can keep users awake and seriously mess with their sleeping patterns. F.lux works to counteract this.

F.lux uses color temperature to describe the quality of lighting. Color temperature is often used in photography and is typically a single number in Kelvin (K) units. For example, typical values are candle light 2000K, bright sunlight 6000K and sunset 3500K — wikipedia has a list of well-known values. By applying color temperature blending to a photograph or, in f.lux’s case, to a computer screen, the effect is as if the photograph or computer screen is lit by a light of that temperature, for instance the calming effects of sunset light.

Recipes for homestar.io are implemented in Javascript and homestar.io provides utilities described using RGB to manage lighting across a wide range of color control devices such as Philips Hue and LIFx. So to write the f.lux recipe, I needed a Kelvin to RGB convertor in Javascript. Given the ubiquity of both color temperature and RGB in photography, I assumed there would be plenty of well-known algorithms available and even a standard Javascript package or two on NPM. However, neither assumption turned out to be true. So I ended up writing a Node package called color-temperature to convert the color temperature from Kelvin to RGB.

Source code is available here and the NPM package here.

An Algorithm to Convert Color Temperature to RGB

As a starting point, I used an algorithm written by Tanner Helland, the author of PhotoDemon a photo manipulation tool.

Tanner’s approach is to take a sparse color temperature and RGB mapping dataset provided by Mitchell Charity’s raw blackbody datafile and do a curve fit to the data to devise a simple algorithm that converts a color temperature in Kelvin to an RGB value. Tanner has implemented his algorithm in VisualBASIC and, additionally, commenters on his blog have further converted the algorithm to other languages such as Python.

I recommend reading Tanner’s blog post to get an understanding of the approach.

(Re)Fitting the Data

I like the approach. It is simple and gives good results, however, as Tanner commented on his blog, he felt with more tweaking the fit function could be improved — though likely at marginal gain. However, when looking at spectrum images generated form the algorithm, I did notice that some regions of the spectrum were subtly (but visibly) different to published color temperature range images especially in the region 6000-7000K. So even though the difference was very small and in a fairly narrow range of the spectrum, I decided to go back to the original mapping data and refit a curve function.

Here is the original data graphed in all its glory:

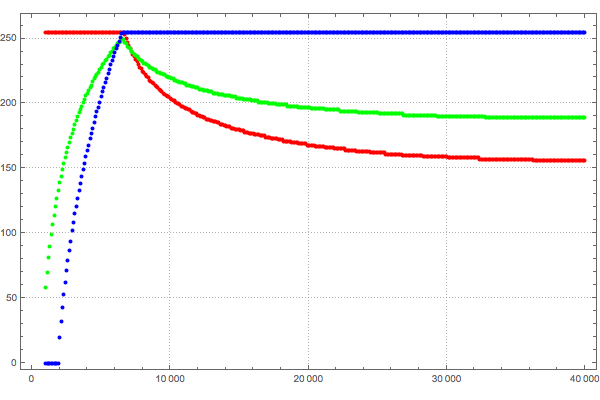
The x-axis is the Kelvin color temperature in K and Y axis is the RGB integer value between [0, 255] for each of the colors red, green, blue. From a curve-fitting perspective, this data can be thought of as four regions that need curve fitting:

(1) kelvin → red >= 6700K
(2) kelvin → 1000K < green < 6700K
(3) kelvin → green >= 6700
(4) kelvin → 2000K < blue < 6700 K

in all other areas the values are either 0 or 255.

It is hopefully clear from this graph that color temperature is not a complete colorspace, it is simply a set of RGB values that correspond to Kelvin black body temperatures: there are plenty of RGB values that do not correspond to black body radiation colors. Also the data is discrete and not every integer color temperature has a value.

A curve fit finds a continuous function that matches a set of discrete points closely. To perform the curve-fit, I used Mathematica Home Edition V10 and I used the FindFit function to find a curve fit for each of the 4 mapping regions. A curve fit function needs a general function to fit against, I used the fit function

\(a + b x + c ln(x)\)

where x is the kelvin value and which in Mathematica is written as for example

FindFit[Drop[allKelvinRed, 57], a + b x + c  Log[x], {a, b, c}, x];

I tweaked the data by pre-scaling the data before I did the FindFit. This achieved better results — although it limits the range of values the function will handle to above approx 1000K. The original algorithm had similar restrictions. This is no big deal, as for real world uses nothing much of interest happens below 1000K, and also the original dataset did not contain information below 1000K.

I then compared the results to both the source data and to the original algorithm output - the purpose of the latter comparison was to look for meaningful differences that would account for the visual effects I was seeing.

Below is a table comparing the new candidate curve fit for each of the regions with Tanner’s original curve fit.


Fit Region Orig Candidate
kelvin ->
red >= 6600K
\(a x^b\)

where

a = 329.698727446
b = -0.1332047592
x = (kelvin/100) - 60

\(a + b x + c ln(x)\)

where

a = 351.97690566805693
b = 0.114206453784165
c = -40.25366309332127
x = (kelvin/100) - 55

kelvin ->
1000K < green < 6600K
\(a +b ln(x)\)

where

a = -161.1195681161
b = 99.4708025861
x = (kelvin/100)

\(a + b x + c ln(x)\)

where

a = -155.25485562709179
b = -0.44596950469579133
c = 104.49216199393888
x = (kelvin/100) - 2

kelvin ->
green >= 6600
\(a x^b\)

where

a = 288.1221695283
b = -0.0755148492
x = (kelvin/100) - 60

\(a + b x + c ln(x)\)

where

a = 325.4494125711974
b = 0.07943456536662342
c = -28.0852963507957
x = (kelvin/100) - 50

kelvin ->
2000K < blue < 6600 K
\(a +b ln(x)\)

where

a = -305.0447927307
b = 138.5177312231
x = (kelvin/100) - 10

\(a + b x + c ln(x)\)

where

a = -254.76935184120902
b = 0.8274096064007395
c = 115.67994401066147
x = (kelvin/100) - 10

Fit Error

So how well does the algorithm match the original data?

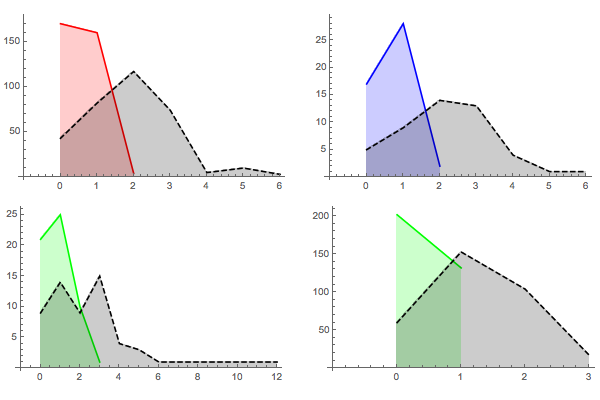
Below are the distributions of the fit error for each of the four regions.

I measured the fit error in terms of a count of the integer differences between the original color value and the color generated by the algorithm. This is separated out into each of the colour components: one for each of red, green, and blue. For instance an integer difference of zero means that the algorithm exactly matched the original data, a difference of one means that the value is off by 1 either above or below. e.g. if the original data gave a value of red=168 then the algorithm generating a value of 167 or 169 would both be classified as a difference of one.

I then graphed the fit error so I could visually compare the differences. The colored area of the graph is the result of the new algorithm compared to the original data and the grey area is Tanner’s findings compared to the data. In all cases, the new algorithm matches more closely and has less distribution spread than the older mappings. BTW I apologize to any visualization experts reading this — I know bar charts are the better representation for integer data, but I find the graphs kind of cool looking.

So when looking at the graphs, best results are implied for data that is higher and more concentrated in the left.

The really interesting part of the entire distribution is the area around 6700K. This is the area that I can visibly see some differences to published spectra. For the original algorithm, images became slightly more yellow than expected. The new mapping does not have this yellowness in this region. Looking in detail at this region, we can see why. The following are selected points in the region for each of the color components of red, green and blue. The first is the New mapping, the second is the original source data, and the third is the original mapping.


New Mapping

Source Data
01c8b088072242385afcd2e309a6dd0b.png

Original Mapping

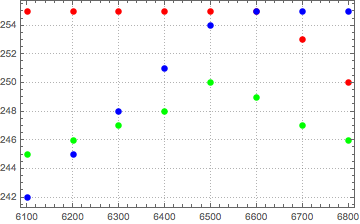
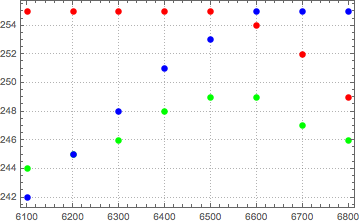
As can be seen above, in the original mapping, green stays above blue and is much higher than the source data for much of the region. The comparison between the new algorithm and the source data shows a much closer correspondence. The relative ordering of the colors at each Kelvin temperature of very close indeed.

My Mathematica notebook can be found here

Thanks

I’d like to thank Tanner for developing the approach as well as for publishing his original algorithm and making his spreadsheet and code publicly available. I’ve not used his PhotoDemon, but it looks like a great tool.

In my recent post about using Bluemix and Arduinos, I had to port the Bluemix sample temperature sensor reading code which was written for the Arduino Uno to the Yun.

Both the Uno and the Yun use microprocessors from Atmel, however, the Uno uses the ATmega328P and the Yun uses the ATmega32U4. Each of these chips supports an internal temperature sensor that can be read using an internal analog-to-digital convertor (ADC), however, the calibration, setup and process of reading are not the same.

The original Bluemix sample code uses the following to read the Uno temperature sensor.

double getTemp(void) {
  unsigned int wADC;
  double t;
  ADMUX = (_BV(REFS1) | _BV(REFS0) | _BV(MUX3));
  ADCSRA |= _BV(ADEN); // enable the ADC
  delay(20); // wait for voltages to become stable.
  ADCSRA |= _BV(ADSC); // Start the ADC
  // Detect end-of-conversion
  while (bit_is_set(ADCSRA,ADSC));
  // Reading register "ADCW" takes care of how to read ADCL and ADCH.
  wADC = ADCW;
  // The offset of 324.31 could be wrong. It is just an indication.
  t = (wADC - 324.31 ) / 1.22;
  // The returned temperature is in degrees Celcius.
  return (t);
}

 
This is using two registers — ADMUX and ADCSTA — to control the temperature conversion process. Various bits are set in the registers to configure the process the the ADSC bit is set in ADCSRA to start the conversion and reset when the conversion ends. Note that the Arduino IDE supports the names of the registers and the bits within the registers which is a nice feature.

Yun schematic
ATmega32U4-ADC-Schematic-500

The Yun, in comparison, uses three control registers — ADMUX, ADCSTA and ADCSTB — to first configure the temperature conversion process. It does however use the ADSC bit in the ADCSRA to start the conversion and test for completion.

32u4ADCRegisters
The Atmel docs for the Yun’s processor recommend that we throw away the first reading, so the first call to getTemp() should be discarded.

void setupADC(){
  //ADC Multiplexer Selection Register
  ADMUX = 0;
  ADMUX |= (1 << REFS1);  //Internal 2.56V Voltage Reference with external capacitor on AREF pin
  ADMUX |= (1 << REFS0);  //Internal 2.56V Voltage Reference with external capacitor on AREF pin
  ADMUX |= (0 << MUX4);  //Temperature Sensor - 100111
  ADMUX |= (0 << MUX3);  //Temperature Sensor - 100111
  ADMUX |= (1 << MUX2);  //Temperature Sensor - 100111
  ADMUX |= (1 << MUX1);  //Temperature Sensor - 100111
  ADMUX |= (1 << MUX0);  //Temperature Sensor - 100111
  //ADC Control and Status Register A 
  ADCSRA = 0;
  ADCSRA |= (1 << ADEN);  //Enable the ADC
  ADCSRA |= (1 << ADPS2);  //ADC Prescaler - 16 (16MHz -> 1MHz)
  //ADC Control and Status Register B 
  ADCSRB = 0;
  ADCSRB |= (1 << MUX5);  //Temperature Sensor - 100111
}
double getTemp() {
  ADCSRA |= (1 << ADSC);  //Start temperature conversion
  while (bit_is_set(ADCSRA, ADSC));  //Wait for conversion to finish
  // ADCW combines ADCL and ADCH into single 16 bit number
  double temperature = ADCW;
  return temperature - 273.4;
}


An Honest Temperature

I had a physics prof at school who was a stickler for reporting the results of experiments. He insisted that we write up experiments in pen as opposed to pencil (otherwise he would rant that we “didn’t have confidence in our results”) and demanded error bars on the tolerance of the presumed accuracy of the result — along with error estimate calculations. And more importantly to a young student, he would deduct marks for being too precise. This has stuck with me: An inappropriate precision is misleading and, to my way of thinking, not an honest representation of information.

The original Uno code uses floating point precision to report the temperature. However, even when calibrated the chip temperature sensors in typical Atmel microprocessors are accurate to +-2% and uncalibrated can be +/10%. The sensor readings are ballpark temperature numbers, so we should also report the data with less precision — so I’ve chosen to use integers for the temperature as opposed to the floating point and to use a a rounded number for the Kelvin to Celsius conversion.

This gives the final version of the code: A realistic (if not too accurate) temperature value.

void setupADC(){
  //ADC Multiplexer Selection Register
  ADMUX = 0;
  ADMUX |= (1 << REFS1);  //Internal 2.56V Voltage Reference with external capacitor on AREF pin
  ADMUX |= (1 << REFS0);  //Internal 2.56V Voltage Reference with external capacitor on AREF pin
  ADMUX |= (0 << MUX4);  //Temperature Sensor - 100111
  ADMUX |= (0 << MUX3);  //Temperature Sensor - 100111
  ADMUX |= (1 << MUX2);  //Temperature Sensor - 100111
  ADMUX |= (1 << MUX1);  //Temperature Sensor - 100111
  ADMUX |= (1 << MUX0);  //Temperature Sensor - 100111
  //ADC Control and Status Register A 
  ADCSRA = 0;
  ADCSRA |= (1 << ADEN);  //Enable the ADC
  ADCSRA |= (1 << ADPS2);  //ADC Prescaler - 16 (16MHz -> 1MHz)
  //ADC Control and Status Register B 
  ADCSRB = 0;
  ADCSRB |= (1 << MUX5);  //Temperature Sensor - 100111
}
double getTemp(){
  ADCSRA |= (1 << ADSC);  //Start temperature conversion
  while (bit_is_set(ADCSRA, ADSC));  //Wait for conversion to finish
  // We could report an precise number but accuracy is only +/-2% at best.  
  // take an honest approach to reporting the temp as we know it */
  byte low  = ADCL;
  byte high = ADCH;
  int temperature = (high << 8) | low;  //Result is in kelvin
  return temperature - 273;
}

In a recent post, I showed how to connect the Yun to the Bluemix Node-RED quickstart service — for some basic Internet of Things functionality.

In this post, I improve the code to make it easier to deploy.

The original code required manual entry of the mac address of the Yun which I felt was very clunky. So here is my improved version: the code automatically discovers the mac address and in addition presents the user with a simple link to the Bluemix webpage that will display the Yun temperature sensor data. In addition, I’ve fixed a few minor issues and added some better error trapping.

For added convenience, I’ve put the code on github. It is now a (hopefully) simple download with no editing required to get it up and running on the Yun. So the steps to get this going are:

  1. Download the MQTT library:
    git clone https://github.com/knolleary/pubsubclient.git
  2. Import the MQTT library into the Arduino IDE: In the Arduino IDE use the menu Sketch/Import Library/Add Library… and navigate to the pubsubclient location from the step above and chose the PubSubClient directory
  3. Download the Ardunio Yun sketch : clone the following project from Github:
    https://github.com/neilbartlett/ArduinoYunBluemix.git
  4. Open the quickstart-yun sketch in the Arduino IDE, build the sketch, upload to a Yun.
  5. Login to Bluemix
  6. Fire up the Arduino console and cut and paste the URL written to the console into a browser.

The above assumes you have a Yun that is already configured to access the net and powered up — other than that it is good to go. The full (still somewhat ugly code) is below. Enjoy!

#include <YunClient.h>
#include <PubSubClient.h>
#include <Console.h>
YunClient yunClient;
PubSubClient mqtt("messaging.quickstart.internetofthings.ibmcloud.com", 1883, 0, yunClient);
unsigned long time;
// String pubString;
char pubChars[50];
char connectChars[50];
String macAddrStr;
void setup()
{
  Bridge.begin();
  Console.begin();
  // wait for the console to connect so we can see what's happening
  while (!Console){
    ; // wait for Console port to connect.
  }
  // get the mac address from the linux half of the Yun board
  String s = getMacAddressString();
  s.replace(":","");
  s.toLowerCase();
  macAddrStr = s.substring(0,12);
  Console.println("mac address="+macAddrStr);
  Console.println("link to https://quickstart.internetofthings.ibmcloud.com/#/device/"+macAddrStr);
  // connect to node-RED quickstart to receive messages
  String connectStr="d:quickstart:yun:"+macAddrStr;
  connectStr.toCharArray(connectChars, connectStr.length() + 1);
  if (!mqtt.connect(connectChars)) {
    Console.println("error connecting");
  }
  // set up the ADC to read the internal temperature sensor
  setupTempSensor();
}
void loop()
{
  if (millis() > (time + 5000))
  {
    time = millis();
    float temp = getTemp();
    String pubString = "{\"d\":{\"temp\":" + String(temp) + "}}";
    Console.println(pubString+"->"+macAddrStr);
    pubString.toCharArray(pubChars, pubString.length() + 1);
    if (!mqtt.publish("iot-2/evt/status/fmt/json", pubChars)) {
      Console.println("publish error");
    }
  }
  if (!mqtt.loop()) {
      Console.println("loop error");
  }
}
void setupTempSensor() {
  setupADCFortempSensorReading();
  // throw away the first reading and wait a while -- as per the recommendations on the Atmel docs
  getTemp();
  delay(1);
}
void setupADCFortempSensorReading() {
  //ADC Multiplexer Selection Register
  ADMUX = 0;
  ADMUX |= (1 << REFS1);  //Internal 2.56V Voltage Reference with external capacitor on AREF pin
  ADMUX |= (1 << REFS0);  //Internal 2.56V Voltage Reference with external capacitor on AREF pin
  ADMUX |= (0 << MUX4);  //Temperature Sensor - 100111
  ADMUX |= (0 << MUX3);  //Temperature Sensor - 100111
  ADMUX |= (1 << MUX2);  //Temperature Sensor - 100111
  ADMUX |= (1 << MUX1);  //Temperature Sensor - 100111
  ADMUX |= (1 << MUX0);  //Temperature Sensor - 100111
  //ADC Control and Status Register A 
  ADCSRA = 0;
  ADCSRA |= (1 << ADEN);  //Enable the ADC
  ADCSRA |= (1 << ADPS2);  //ADC Prescaler - 16 (16MHz -> 1MHz)
  //ADC Control and Status Register B 
  ADCSRB = 0;
  ADCSRB |= (1 << MUX5);  //Temperature Sensor - 100111
}
double getTemp(){
  ADCSRA |= (1 << ADSC);  //Start temperature conversion
  while (bit_is_set(ADCSRA, ADSC));  //Wait for conversion to finish
  // We could report an precise number but accuracy is only +/-2% at best.
  // ADCW combines ADCL and ADCH into single 16 bit number
  //  double temperature = ADCW;
  //  return temperature - 273.4;
  // take an honest approach to reportimg the temp as we know it */
  byte low  = ADCL;
  byte high = ADCH;
  int temperature = (high << 8) | low;  //Result is in kelvin
  return temperature - 273;
}
/**
 * Get a mac address for this Yun board. Note the mac address of the wireless and the ethernet can be different
 * this code just gets a unique address for this device.
 */
String getMacAddressString() {
  Process p;
  // use the ethernet port. Could use the wireless port too.
  // the grep command simply looks for a string of the type DD:DD:DD:DD:DD:DD
  // the -o prints only the matched (non-empty) parts of matching lines, with each such part on a separate output line. 
  // we are passing the grep the output of the ifconfig for eth0 so we only expect one mac address to be found
  p.runShellCommand("ifconfig eth0 | grep -o -E '([[:xdigit:]]{1,2}:){5}[[:xdigit:]]{1,2}'");
  // do nothing until the process finishes, so you get the whole output:
  while (p.running());
  // if the process has finished and return no data then we have busted Yun.
  if (p.available() )
  { 
    return p.readString();
  }
  return "";
}

Quick update on the Voltage and data logger project.

Sadly the RPiSoc project on Kickstarter didn’t reach its funding level.  Good luck to the guys at EmbeditElectronics. Hopefully they can figure out a way to get RiPSOC funded and built.

So I’ve had to reconsider the PSOC - Pi connection for this project. I’ll probably use a direct connection to a FreeSoc board (an older Kickstarter project) that I have spare.

Let’s look at connecting an Arduino Yun to the cloud using Node-RED — the Bluemix Internet of Things (IoT) service.

Bluemix is IBM’s new cloud app dev environment. It includes point and click software-as-a-service installs such internet of things services, database storage and analytics. The good news is many Bluemix services are free to try out with generous quotas to allow real world examples to run — so a great way to get stuff up and running fast.

Node-RED allows creation of IoT services. Bluemix provides two main approaches to using Node-RED: quickstart which is a pre-defined service that will receive and graph sensor data; and custom full-featured app development. We’re going to use quickstart. For quickstart, there is standard sample code to connect an Ardunio Uno to the Internet and use the Uno to send temperature sensor readings to the cloud which are then available via a browser graphed on a timeline. The docs for that are here https://developer.ibm.com/iot/recipes/arduino-uno/.

Personally, I prefer the Ardunio Yun to the Uno when connecting projects to the Internet as the Yun doesn’t require any additional shields to connect; The Yun has wireless and ethernet pre-built on the board. Nice and simple. So I wanted to connect the Yun instead of an Uno to Node-RED.

However, there is no free lunch for the software developer here. The Yun’s internal structure is not the same as a typical Arduino such as the Uno. Simply running the sample Bluemix Node-RED Uno sketch on the Yun won’t work. A bit of hacking is required.

The Yun is really two devices in one — an Arduino microprocessor and a Linux computer — as opposed to the Uno which is just an Arduino. When a network shield is connected to an Uno, the microprocessor in the Uno — the Atmel 328P — has direct access to the network device that connects the Arduino to the Internet; In the Yun, the network hardware is NOT connected directly to the microprocessor. Instead, it is connected to the Linux half — an Atheros AR 9331 chip running a linux variant called Linino. So in the Yun, the Arduino half needs to communicate with the Linux half to access the networking device. This makes life a little more complicated for the software developer, but makes for a simpler setup with the form factor. Swings and roundabouts as we say in the country I was born in.

So the game plan is to construct a new Arduino sketch configured for the Yun.

Below is the new code you will need to get the Yun running. You will need to supply the mac address for your Yun in XXXXXXXXXXXX.

#include <YunClient.h>
#include <PubSubClient.h>
#include <Console.h>
YunClient yunClient;
PubSubClient mqtt("messaging.quickstart.internetofthings.ibmcloud.com", 1883, callback, yunClient);
unsigned long time;
float temp;
String pubString;
char pubChars[50];
void setup()
{
  Bridge.begin();
  Console.begin();
  mqtt.connect("d:quickstart:sensors:XXXXXXXXXXXX");
  setupADC();
}
void loop()
{
  if (millis() > (time + 5000))
  {
    time = millis();
    temp = getTemp();
    pubString = "{"d":{"temp":" + String(temp) + "}}";
    Console.println(pubString);
    pubString.toCharArray(pubChars, pubString.length() + 1);
    mqtt.publish("iot-2/evt/status/fmt/json", pubChars);
  }
  mqtt.loop();
}
void setupADC(){
  //ADC Multiplexer Selection Register
  ADMUX = 0;
  ADMUX |= (1 << REFS1);  //Internal 2.56V Voltage Reference with external capacitor on AREF pin
  ADMUX |= (1 << REFS0);  //Internal 2.56V Voltage Reference with external capacitor on AREF pin
  ADMUX |= (0 << MUX4);  //Temperature Sensor - 100111
  ADMUX |= (0 << MUX3);  //Temperature Sensor - 100111
  ADMUX |= (1 << MUX2);  //Temperature Sensor - 100111
  ADMUX |= (1 << MUX1);  //Temperature Sensor - 100111
  ADMUX |= (1 << MUX0);  //Temperature Sensor - 100111
  //ADC Control and Status Register A
  ADCSRA = 0;
  ADCSRA |= (1 << ADEN);  //Enable the ADC
  ADCSRA |= (1 << ADPS2);  //ADC Prescaler - 16 (16MHz -> 1MHz)
  //ADC Control and Status Register B
  ADCSRB = 0;
  ADCSRB |= (1 << MUX5);  //Temperature Sensor - 100111
}
double getTemp(){
  ADCSRA |= (1 << ADSC);  //Start temperature conversion
  while (bit_is_set(ADCSRA, ADSC));  //Wait for conversion to finish
  // We could report an precise number but accuracy is only +/-2% at best.
  // ADCW combines ADCL and ADCH into single 16 bit number
  //  double temperature = ADCW;
  //  return temperature - 273.4;
  // take an honest approach to reporting the temp as we know it */
  byte low  = ADCL;
  byte high = ADCH;
  int temperature = (high << 8) | low;  //Result is in kelvin
  return temperature - 273;
}
void callback(char* topic, byte* payload, unsigned int length) { }

To get this code to work, you’ll need an additional library for MQTT — the protocol Node-RED uses to communicate with IOT devices such as sensors and microprocessors. MQTT is a very lightweight protocol — compared to HTTP — and is a common choice for IoT comms. The Yun sketch uses the library written by Nick O’Leary to send the MQTT messages from an Arduino. First, clone Nick’s code from here using git

git clone https://github.com/knolleary/pubsubclient.git

then import the library into the Arduino IDE sketch environment (In the Arduino IDE Sketch/Import Library/Add Library… and chose the PubSubClient directory). Build the sketch, upload this to your Yun, and connect your Yun to the Internet either via the wireless or Ethernet using the standard Yun instructions.

Now logon to Bluemix (or sign up for the trial account if you haven’t already done so). From the dashboard view, follow these steps:

From the Dashboard, “ADD A SERVICE”
Select Internet of Things
Launch the Service

Wait for the service to start.

If you now look at the console, the messages should be succeeding. This means that Node-RED is gathering sensor readings from your Yun. You may need to reboot the Yun.

Viewing the output

To view the real-time output we need a web browser pointed at a URL that links to data for our device. The mac address is used as the device identifier. So use the following URL with your 12 digit hex mac address for your device.

https://quickstart.internetofthings.ibmcloud.com/#/device/insert-your-12-hex-digit-mac-address-here/sensor/

How it Works

This code uses the quickstart approach to interface the Yun. This is the quickest way to get the device connected and does not require intricacies such as device registration. Quickstart runs a service that uses some pre-defined locations and naming conventions to do its magic.

The first thing is to connect to the default quickstart domain:

messaging.quickstart.internetofthings.ibmcloud.com

using the code:

PubSubClient mqtt("messaging.quickstart.internetofthings.ibmcloud.com", 1883, callback, yunClient);

You should be able to ping this domain from your network. Quickstart uses MQTT which sits on top of TCP-IP. The standard port is 1883. Next, we need to connect to the service using a clientId of the form:

d:<org-id>:<type-id>:<device-id>

Where the <org-id> is the special value quickstart and the <type-id> is sensors and the <device-id> is the mac address of the Yun. Note there is nothing particularly sacred about the <type-id> and the <device-id> except that the <device-id> needs to be unique across the entire quickstart service which is a multi-tenant service. The mac address is a globally unique way to ensure this - the network chip manufacturers have taken care of this detail for us.

mqtt.connect("d:quickstart:sensors:XXXXXXXXXXXX");

The code then loops every 5 seconds reading the internal temperature sensor and sending a fragment of JSON which contains the temp in Celsius. This is published to the topic

iot-2/evt/<event-type>/fmt/<format>

with QoS=0. This is accomplished using the following library call:

mqtt.publish("iot-2/evt/status/fmt/json", pubChars);

The pubChars use the following JSON format.

{"d":
     {"temp": 35.00}
}

The Node-RED quickstart service receives the sensor temp and auto-magically graphs status events on a timeline graph.

BTW the code to read the internal temperature sensor is another difference the Uno and the Yun. The Bluemix Uno code uses some bit twiddling to read the sensor. This involves setting some registers to configure the Atmel chip to use the inbuilt temperature sensor as the input to the analogue-to-digital convertor (ADC) and then triggering the ADC to convert the temperature sensor data. Unfortunately, the 328P in the Uno and the 32U4 in the Yun have a different setup. So we will need to change the temperature reading code. You can read about the details in a separate blog post.

Wrap

This covers the basics of the connecting a Yun to the cloud using Bluemix and Node-RED. There are still plenty more things to do here. For example, the system doesn’t yet record any data — it just sends it and graphs the most recent set of data. Also Node-RED allows for custom workflows and for callbacks to the Yun — for example if a particular state such as “core too hot” is reached, we could remotely shut down the Yun if we wished to. We are not limited to sending just temperature, we can send multiple sensor readings at the same time if we want; A really interesting use case is to include the temp reading in general projects and use the temp to check if the Arduino is running well. Hopefully, I’ll get to these ideas in another post.


As part of a larger project, I want to optimize the design of a home-grown electric power source. The power source produces an irregular output that I want to harvest:

To compare design variants, I’m designing a standardized test rig, part of which needs to log high precision voltage and current for the duration of a test. The test rig needs be able to resolve 40Khz waveforms — so I need to be able capture at at least an 80Khz frequency — for several minutes and potentially several hours when I hook up the load to the source.

The design I have settled on is to use a PSOC as the analog front-end and a Raspberry Pi as the data logging capture device.

Why PSOC?

PSOC from Cypress is one of the best kept secrets of interfacing analog and digital. It is a much more powerful and capable than say an Arduino.

What is very cool is that the PSOC chips can be hardware configured from software without using wiring. For example whereas for an Arduino, wires and addition buffer chips are often necessary for typical uses, with the PSOC the whole thing is configured in a drag and drop user interface — no wiring necessary.

And no sacrifice is made to performance. In fact a typical PSOC greatly outperforms an Arduino and makes it “look like a toy” (quotes are from some older SparkFun ads). Some comprison points:

  • 1.024V +/- 0.1 precision voltage reference.
  • Precision analog comparators, op amps, I/VDACs and CapSense touch technology.
  • 2×12-bit SAR ADC.
  • 8-20bit DeltaSigma ADC (Analog to Digital Convertor):


These features compare very favourably to even the latest 32-bit Due Arduino (which itself is radically better than a standard Arduino). The Due does have a few more ADCs but they are less precise (no 20bit ADC!) and less flexible than the PSOC. The Due does score with a 84Mhz verses the PSOC 80-Mhz chip speed.

Why a Pi?

The Pi is used to offload the logging. This allows a nice division of labour with the PSOC and allows for programming the access to the data once the 

I plan to connect the PSOC to the PI using SPI. Here is the connection using PSOC kit

BTW The ideal tool for this project is the new Kickstarter RPiSoc. This is a PSOC 5LP chip board with direct Raspberry Pi as well as Arduino hardware connectivity. The project also comes with software libraries to ease the connectivity. Check it out at RPiSoc.

More on the requirements  and design in the next post in this series.